Industrial IoT Monitoring
LiveData Center Digital Twin
Software digital twin of data-center electrical and cooling infrastructure with Modbus TCP, MQTT, telemetry, alarms, fault scenarios, and an operator monitoring interface.
In numbers
In numbers
- data halls modelled
- 2
- facility simulation cycle
- 5 s
- fault scenarios
- 4
Context
A software digital twin for simulating data center electrical and cooling infrastructure. It is a simulation, not a live production data center.
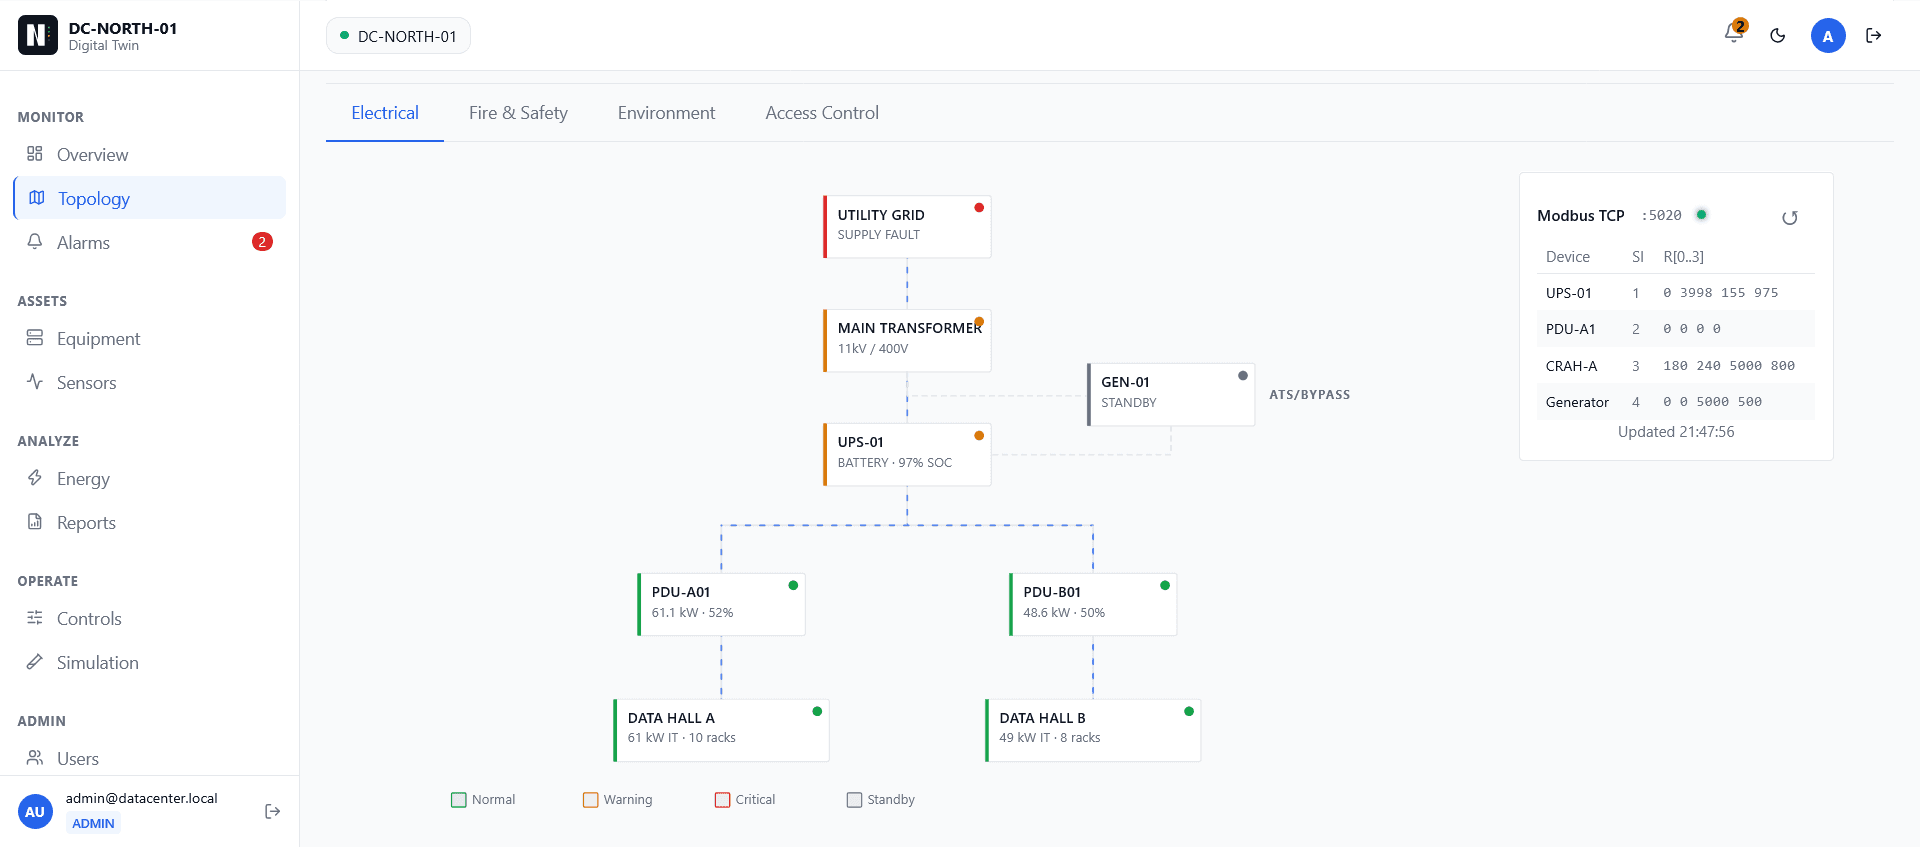
The twin models 2 data halls and runs a facility simulation every 5 seconds covering UPS infrastructure, PDUs, CRAH units, a standby generator, and rack load.
Approach
The simulation uses the industrial protocols Modbus TCP and MQTT. A FastAPI backend provides REST and WebSocket APIs, persists telemetry in PostgreSQL, and pushes live state to the operator dashboard.
- Alarms and 4 fault scenarios.
- A Next.js operator dashboard for live facility state.
- Prometheus and Grafana for metrics.
- Authentication, API keys, rate limiting, and role-based control.
Features
Electrical chain
UPS, PDUs, a standby generator, and rack load across 2 data halls.
Cooling
CRAH units modelled as part of the facility simulation.
Industrial protocols
Modbus TCP and MQTT.
Alarms and faults
Alarm handling and 4 fault scenarios.
Operator dashboard
Next.js interface with live updates over WebSocket.
Observability
Prometheus metrics and Grafana dashboards.
Architecture
- Simulation
- Facility simulation, 5-second cycle
- Fault scenarios
- Protocols
- Modbus TCP
- MQTT
- Backend
- Python
- FastAPI
- PostgreSQL
- WebSocket
- Interface
- Next.js operator dashboard
- Operations
- Prometheus, Grafana
- Docker, Kubernetes manifests
- GitHub Actions
- AWS deployment configuration
Gallery
1 of 4Overview: live power trend, facility status and data hall health
Tech stack
- Python
- FastAPI
- MQTT
- Modbus TCP
- PostgreSQL
- WebSocket
- Next.js
- Prometheus
- Grafana
- Docker
- Kubernetes
- GitHub Actions
- AWS